Understanding Benchmarks: A Complete Guide to Performance Metrics


Understanding Benchmarks: A Complete Guide to Performance Metrics
What Is a Benchmark?
A benchmark is a standard or point of reference against which things may be compared or assessed. In computing and business, it is a specific metric used to measure the performance of a system, process, or asset under controlled conditions. Benchmarks allow for objective comparison—whether between a new processor and its predecessor, a website’s load time against industry averages, or a portfolio’s returns relative to a market index. Without benchmarks, performance claims are subjective; with them, data-driven decisions become possible.
Why Benchmarks Matter
Benchmarks transform raw data into actionable intelligence. They help organizations set realistic goals, identify bottlenecks, inform procurement decisions, and validate optimization efforts. In competitive markets, benchmarks provide a common language for vendors and consumers. For instance, a smartphone manufacturer cites benchmark scores to prove its chip’s superiority, while a cloud provider uses latency benchmarks to justify pricing. Crucially, benchmarks enable continuous improvement by establishing a baseline. If you do not measure where you are, you cannot know if you are moving forward.
Types of Benchmarks
1. Hardware Benchmarks
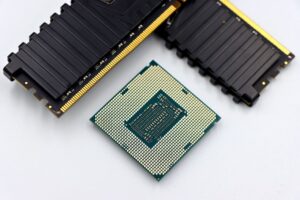
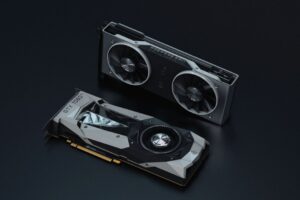
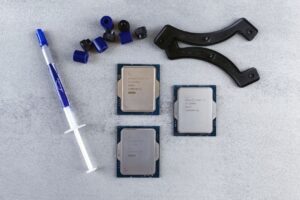
Hardware benchmarks evaluate physical components like CPUs, GPUs, RAM, and storage. Common tools include:
- Geekbench (CPU and GPU)
- Cinebench (rendering performance)
- 3DMark (gaming and graphics)
- CrystalDiskMark (storage read/write speeds)
These tests run standardized workloads—calculating floating-point operations, rendering 3D scenes, or transferring files—and produce scores that allow direct comparison across different hardware configurations.
2. Software Benchmarks
Software benchmarks assess the performance of operating systems, databases, or applications. For example, TPC-C measures database transaction throughput, while JetStream evaluates JavaScript engine speed in browsers. These benchmarks help developers optimize code and users select the fastest platform for specific tasks.
3. System Benchmarks
System benchmarks test the entire stack—hardware, OS, and software—working together. SPEC (Standard Performance Evaluation Corporation) offers suites for CPU, power, and virtualization. These holistic tests reveal real-world performance, such as how quickly a server processes web requests under load.
4. Synthetic vs. Real-World Benchmarks
- Synthetic benchmarks run artificial workloads designed to stress specific components (e.g., PCMark). They offer repeatability and isolation but may not reflect typical usage.
- Real-world benchmarks use actual applications—video editing in Adobe Premiere, file compression in 7-Zip, or game frame rates. They are more representative but harder to standardize.
5. Cloud and Network Benchmarks
Cloud benchmarks measure latency, throughput, and instance consistency (e.g., CloudHarmony). Network benchmarks (e.g., iPerf, Netperf) test bandwidth, jitter, and packet loss. With the rise of edge computing and SaaS, these metrics are critical for service-level agreement (SLA) compliance.
How to Choose the Right Benchmark
Define Your Objective
Start by asking: What am I comparing, and why? A gaming PC requires different benchmarks than a machine-learning workstation. For gaming, focus on GPU-intensive tests like 3DMark and real-world frame-rate runs. For deep learning, benchmark matrix multiplication speed (e.g., MLPerf) and memory bandwidth.
Consider Workload Representation
A benchmark that does not mirror your actual workload is misleading. If you run a MySQL database, use TPC-H queries rather than a generic CPU benchmark. If you host web servers, test concurrent connections and response times, not just peak floating-point operations.
Evaluate Reproducibility and Bias
Legitimate benchmarks are repeatable, documented, and independently audited. Be wary of “cherry-picked” results—vendors may optimize for a specific test. Cross-reference scores from multiple sources (e.g., AnandTech, Tom’s Hardware) and look for confidence intervals or percentiles rather than single numbers.
Understand Metric Pitfalls
Common traps include:
- Mean vs. Median: Average response time can be skewed by outliers; median or 95th percentile is often more meaningful.
- Peak vs. Sustained: A CPU might boost to high clocks briefly but throttle under prolonged load. Look for sustained performance metrics.
- Ignoring Power/Thermal: A faster chip that overheats and throttles may be worse in a silent, small-form-factor PC. Benchmarks like SPECpower account for efficiency.
Interpreting Benchmark Results
Relative vs. Absolute Scores
Most benchmarks produce a relative score (e.g., 10,000 points). Doubling the score does not necessarily mean double the real-world speed—scaling is often sublinear. Use results to rank options but test real applications for final validation.
Statistical Significance
A 5% difference may be noise if the test’s margin of error is ±4%. Run multiple trials and calculate standard deviation. Use tools like PassMark’s “BurnInTest” to verify stability. For network benchmarks, conduct tests at different times of day to account for congestion.
Context Is Everything
A score of 200 fps in a 10-year-old game is meaningless for modern titles. Always compare benchmarks within the same application version, driver set, and operating system. Temperature, background processes, and power settings also influence results—control these variables meticulously.
Common Benchmarking Mistakes
- Testing with Different Settings: A GPU benchmark at 1080p low detail vs. 4K ultra is incomparable. Standardize resolution, quality presets, and drivers.
- Ignoring Thermal Throttling: Run benchmarks long enough to reach steady-state temperature. Short “burst” tests can flatter a system that will throttle under sustained work.
- Benchmarking Without a Baseline: Always record the current state before applying changes (e.g., overclocking, driver update). The baseline provides the “control” for your experiment.
- Using Outdated Benchmarks: A benchmark from 2015 may not stress modern parallel architectures or storage interfaces. Keep your test suite current.
- Overlooking Background Activity: Windows updates, antivirus scans, and cloud syncs skew CPU and disk results. Use a clean boot or a dedicated test partition.
Industry-Standard Benchmark Suites
For Consumers:
- PCMark 10: Holistic system performance for office work, web browsing, and content creation.
- 3DMark: Time Spy (DirectX 12), Fire Strike (DirectX 11), and Port Royal (ray tracing).
- Geekbench 6: Cross-platform CPU and GPU benchmarking with real-world workloads.
For Enterprise:
- SPEC CPU 2017: Integer and floating-point compute performance for servers.
- TPC-C/TPC-H: Database transaction and analytical query throughput.
- MLPerf: Machine learning training and inference performance across hardware.
- SPC-1: Storage system performance (IOPS and latency under mixed workloads).
For Web & Mobile:
- Lighthouse: Website performance, accessibility, and SEO scoring (Google).
- WebPageTest: Detailed waterfall charts for page load analysis.
- Speedometer 3: Browser engine responsiveness for modern web apps.
- AnTuTu: Android device overall performance (CPU, GPU, UX, memory).
Emerging Trends in Benchmarking
AI and ML Benchmarks
As AI becomes pervasive, specialized benchmarks like MLPerf and TensorFlow Benchmark measure training time (e.g., hours to train ResNet-50) and inference latency (e.g., images per second on a GPU). These metrics are critical for data center planners and edge device designers.
Cloud-Native and Serverless Benchmarks
Traditional benchmarks assume dedicated hardware. Cloud benchmarks (e.g., AWS Lambda performance vs. Azure Functions) measure cold-start latency, memory usage, and concurrency limits. Open-source tools like Serverless Framework’s “Benchmark” plugin help compare FaaS providers.
Energy-Efficiency Benchmarks
With sustainability mandates, benchmarks now incorporate power consumption per transaction (e.g., SPECpower_ssj2008, Green500). These metrics balance raw performance with carbon footprint, influencing procurement in eco-conscious organizations.
Real-World Usage-Based Benchmarks
Moving beyond synthetic loads, companies like Microsoft use “Application Performance Index” (Apdex) to measure user satisfaction based on response-time thresholds. Similarly, Google’s “Core Web Vitals” benchmark real user experience on the web—interaction to next paint, cumulative layout shift, and largest contentful paint.
Benchmarking Ethics and Best Practices
- Disclose Methodology: Always publish testing conditions: hardware, OS version, driver version, ambient temperature, number of test runs, and any performance-enhancing features enabled (e.g., XMP, overclocking).
- Avoid Vendor Optimizations: Some benchmarks have been “gamed” by vendors optimizing specifically for that test. Use multiple, independent benchmarks and real-world tests.
- Version Control Benchmarks: Re-run after patches, firmware updates, and hardware changes. A benchmark score is a snapshot, not a permanent rating.
- Consider the User Experience: A benchmark that scores high on paper but stutters in practice is useless. Prioritize metrics that correlate with perceived smoothness, such as frame-time consistency (1% and 0.1% lows) over average FPS.
Implementation Steps: How to Benchmark Your System
- Prepare the Environment: Close all non-essential software, disable background updates, set power profile to “High Performance,” and ensure adequate cooling.
- Update Drivers: Install the latest stable drivers for GPU, chipset, and storage. Document driver versions.
- Run a Baseline: Execute your chosen benchmark suite three times to establish average performance and variability. Record all results.
- Apply Changes: Whether overclocking, swapping hardware, or tuning software, make one change at a time.
- Re-Benchmark: Repeat the same test sequence under identical conditions. Compare scores side-by-side.
- Validate with Real Workloads: Confirm benchmark improvements translate to faster application performance (e.g., shorter video renders, faster compiles, higher game fps).
- Log Everything: Use a spreadsheet to track dates, hardware changes, driver versions, and scores. This historical data is invaluable for troubleshooting regressions.